Analytics
Your analytics page gives you a real-time picture of how Aria is converting leads into bookings.
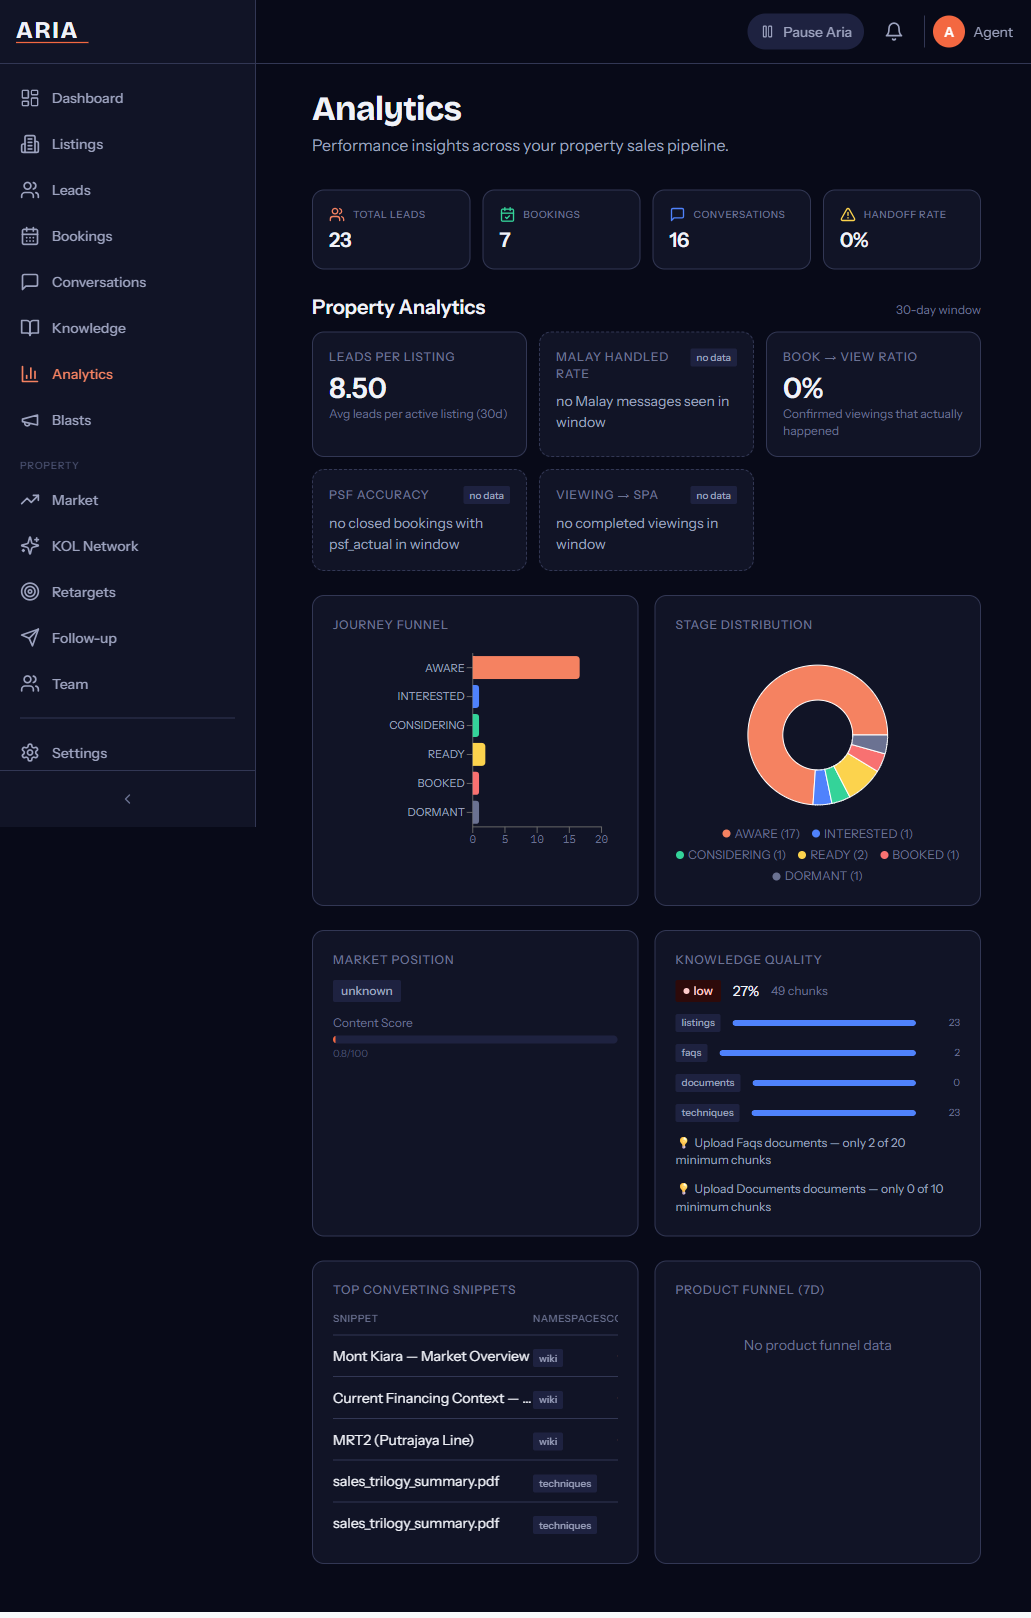
Conversion Funnel
The funnel chart at the top of the page shows how your leads move through each stage — from first contact to booked appointment. Each bar represents a stage, and you can see exactly where leads are dropping off.
Tap any stage to drill down into the leads currently sitting there. This is the fastest way to spot bottlenecks in your sales process.
Key Metrics
Four cards sit below the funnel, updated in real time:
| Metric | What it tells you |
|---|---|
| Total Leads | Every lead that entered your pipeline this period |
| Booking Rate | Percentage of leads that reached a confirmed booking |
| Avg Response Time | How quickly Aria (or your team) replied to new messages |
| Follow-up Effectiveness | Percentage of follow-ups that got a reply from the lead |
Response time is measured from when the lead sends a message to when they receive a reply — whether from Aria or a human team member.
Snippet Performance
The Snippet Performance table ranks your knowledge base documents by how often they contributed to a conversion. Each row shows:
- Document name — the knowledge base file
- Times used — how often Aria referenced this document in conversations
- Conversion rate — percentage of conversations using this snippet that ended in a booking
Use this to identify your best-performing content. If a document has high usage but low conversion, consider rewriting it. If a document has high conversion but low usage, check whether Aria needs better context to surface it more often.
Weekly Insights
Every Monday morning, Aria generates a plain-English summary of your previous week’s performance. The summary covers:
- Total leads received vs the week before
- Booking rate trend (up, down, or flat)
- Your top-performing snippet
- Leads that went cold and may need a manual follow-up
- Any unusual patterns (e.g., spike in after-hours enquiries)
Weekly insights are delivered to your WhatsApp number and also appear at the top of the analytics page every Monday.
Filtering
Use the date picker and stage filters at the top of the page to narrow your view. You can filter by:
- Date range — today, last 7 days, last 30 days, or custom
- Pipeline stage — any combination of stages
- Source — WhatsApp, Messenger, or web chat (if applicable)
Exporting Data
Click Export in the top-right corner to download your analytics as an Excel file. The export includes all leads, their current stage, timestamps, and the snippets used in each conversation.
Export is available on Growth plans and above. Starter plan users can view analytics on-screen but cannot download.